
2026DC Bold Performance Schools
Celebrating 10 years of Bold Schools21 bright spots. DC elementary and middle schools where students from priority groups beat expectations by more than 10 points.
What is the Bold Schools initiative?
EmpowerK12 believes that DC can be the first urban city to close performance gaps this decade. Each year, we celebrate the DC Public Schools (DCPS) and DC public charter schools that make dramatic progress toward that goal by serving students from priority groups exceptionally well.
Meet the 2026 Bold Performance Schools
Twenty-one schools beat their expected proficiency rate by more than 10 points in 2026. Nine return from 2025, three earned the designation in earlier years, and nine earn it for the first time. Each school links to its own website.
 Barnard ES (DCPS)Ward 4, 1 prior designation
 Center City - Congress HeightsWard 8, 5 prior designations
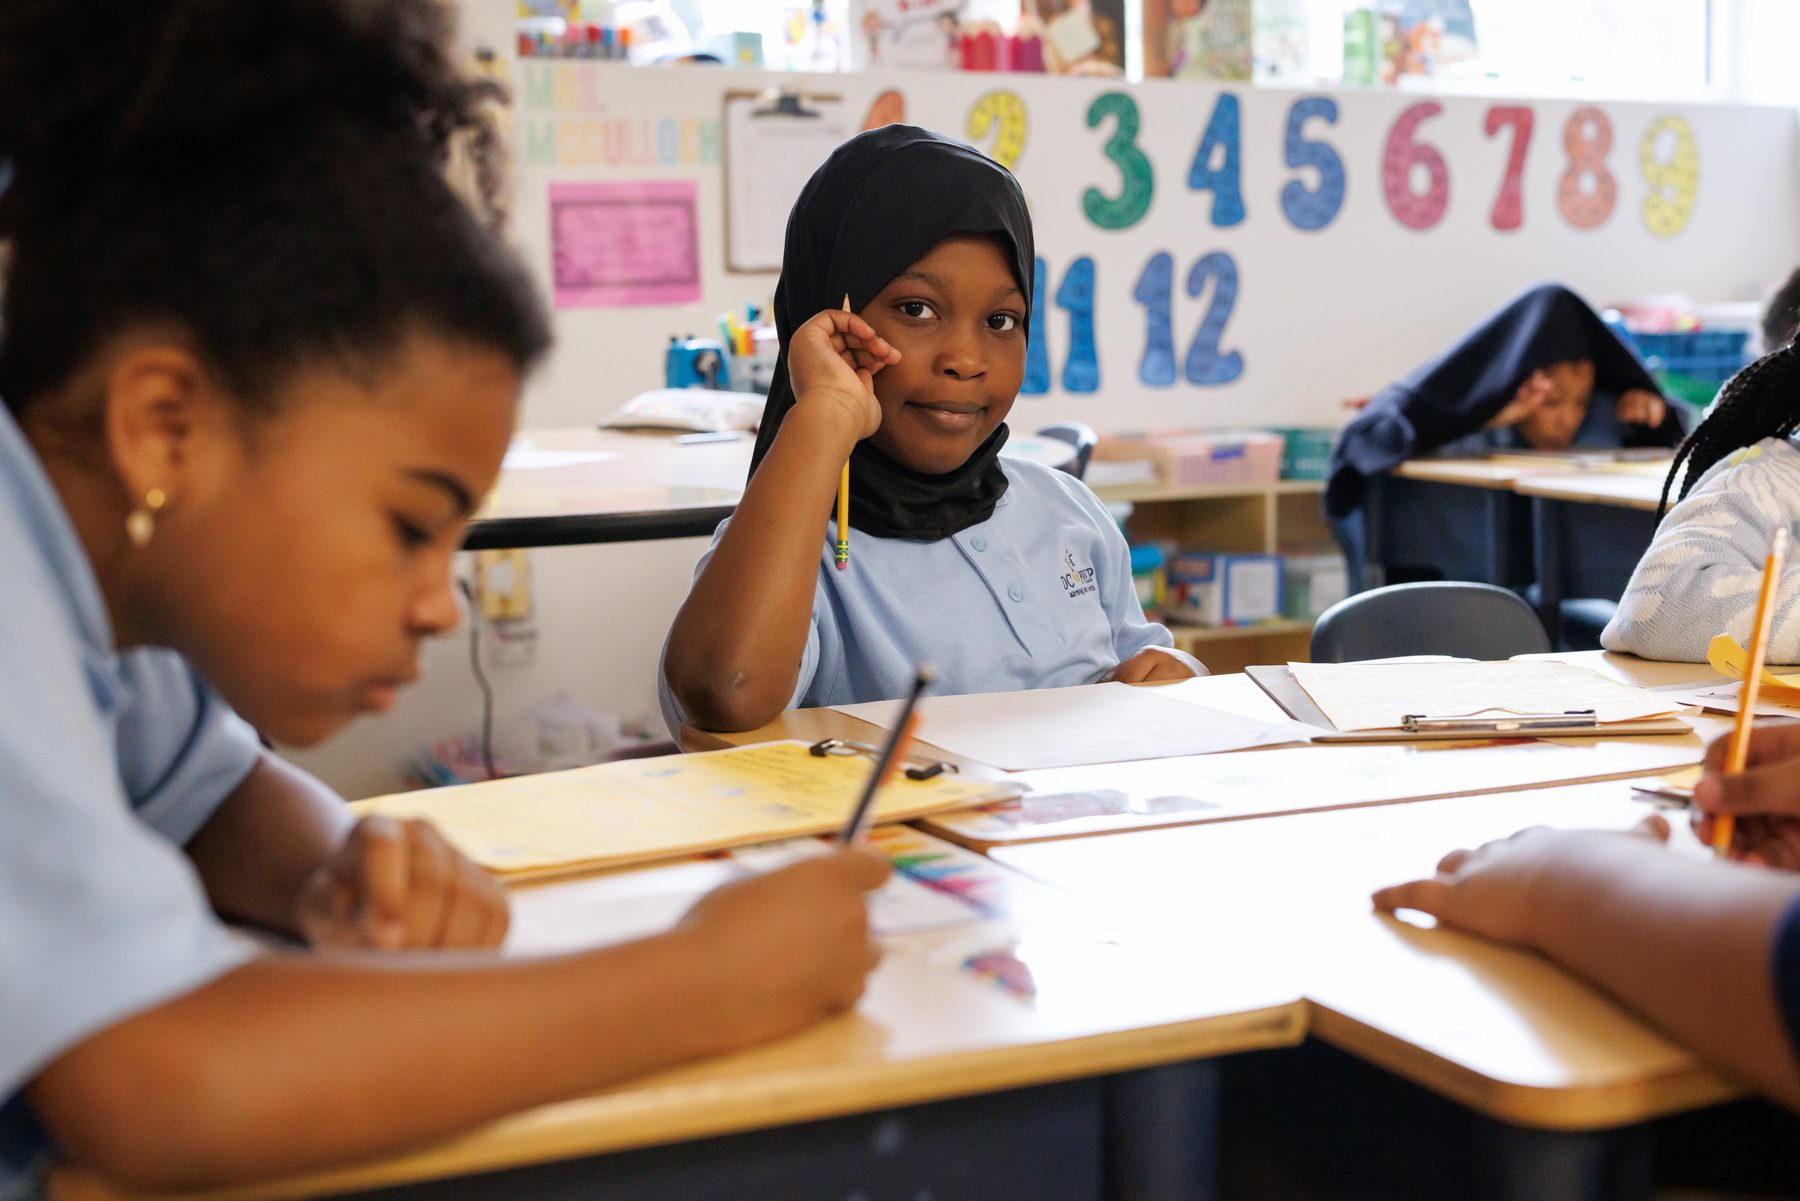
 DC Prep - Edgewood MSWard 5, 5 prior designations
 Friendship - Blow Pierce MSWard 7, 5 prior designations
 Friendship - Chamberlain ESWard 6, 2 prior designations
 Friendship - Ideal ESWard 4, first designation
 Friendship - Ideal MSWard 4, 3 prior designations
 Garfield ES (DCPS)Ward 8, 1 prior designation
 Garrison ES (DCPS)Ward 2, 4 prior designations

 Global CitizensWard 7, first designation
 JO Wilson ES (DCPS)Ward 6, first designation
 Kimball ES (DCPS)Ward 7, first designation
 KIPP DC - PromiseWard 7, 4 prior designations
 LaSalle-Backus EC (DCPS)Ward 4, first designation
 Leckie EC (DCPS)Ward 8, first designation
 Noyes ES (DCPS)Ward 5, 1 prior designation
 Savoy ES (DCPS)Ward 8, first designation
 Stanton ES (DCPS)Ward 8, first designation
 Tubman ES (DCPS)Ward 1, first designation
 Washington GlobalWard 6, 2 prior designations
 Whittier ES (DCPS)Ward 4, 4 prior designations
DCPS = DC Public Schools. All other schools are DC public charter schools. Source: EmpowerK12 Bold Performance Schools analysis of OSSE DC CAPE results, 2025-26.
Three schools shine with special awards
Whittier ES (DCPS)
The highest Percent Proficient Above Expected in the city, 37.2 points.
Friendship - Blow Pierce MS
A Bold Performance School in six of the ten years, including the last four.
Savoy ES (DCPS)
A first Bold designation at a school where 84% of students are at risk.
Bold Schools improve at more than double the rate of similar schools
Bold Schools serve students with backgrounds similar to those at the 112 other DC elementary and middle schools that qualify for Bold consideration, yet their results look very different. In 2026, 62% of students at Bold Schools meet the career-ready benchmark (Level 3 or above) on the DC CAPE in ELA and math combined, compared with 45% of students at other Bold-eligible schools. The difference is largest for economically disadvantaged students, with 57% reaching the benchmark, a higher rate than all students at other Bold-eligible schools.
Since SY22, the first test after the return to in-person learning, Bold Schools gained 21 percentage points for all students and 24 points for economically disadvantaged students. Other Bold-eligible schools gained 9 and 10 points respectively, which means that the Bold Schools improved at more than double the rate of their peers.
Percent of students at Level 3 or above on the DC CAPE ELA and math assessments combined (the career-ready benchmark), weighted by students tested. Both groups are the SY26 cohorts followed back through every year. Pills show each group's gain from SY22 to SY26, in points.
Source: OSSE statewide assessment results (DC CAPE, published as PARCC through 2023), SY22 to SY26, via the EK12 PublicData warehouse. Bold-eligible = elementary and middle schools with more than 30% at-risk students in SY26 that were not designated Bold.
Bold Performance Schools serve a high at-risk student population and have combined math and English language arts proficiency rates dramatically higher than schools serving students with similar demographics. Citywide, 51% of DC students met the career-ready benchmark in math (3+ on DC CAPE) and 60% in English language arts (ELA). For economically disadvantaged students, those numbers are 35% in math and 46% in ELA.
To be a Bold School, a school serves at least 30% students from economically disadvantaged households and has proficiency rates exceeding pre-pandemic expectations for schools serving similar students, as measured in the 2026 DC CAPE assessments. Using Percent Proficient Above Expected (PPAE), which projects what percentage of students are expected to be proficient given a school's demographics, Bold Schools have PPAE rates at least 10 percentage points higher in math and reading combined (PPAE of 10+) than schools with similar demographics.
How we identify Bold Performance Schools
All students, CAPE Level 3+ and 4+ averaged. Each dot is a DC public school with 2025-26 CAPE results. All 21 Bold schools sit above the trend curve. Further right means a larger share of tested students are economically disadvantaged.
Source: OSSE DC CAPE results, 2025-26, via EmpowerK12's PublicData. Level 3+ and 4+ rates pool ELA and math, weighted by tested students. Bold Performance Schools per EmpowerK12's 2026 designations.
In DC and across the country, there is a powerful and persistent correlation between the number of students from priority populations a school serves and its math and reading proficiency rates. Priority populations include economically disadvantaged students, students with disabilities, English learners, and students of color. The larger the priority population at a school, typically, the lower the school's state assessment proficiency rates.
After running the models to predict each school's expected proficiency rates in math and reading, we calculate a school-level Percent Proficient Above Expectations (PPAE) value, the difference between actual and expected performance. As with all predictions, there is some uncertainty in the calculation, so we only select schools with a PPAE that exceeds the absolute error in measurement for the Bold Performance designation, more than 10 percent above expected.
Ten years of Bold Schools and ten lessons
Schools must take bold action to serve students furthest from opportunity. After ten years of Bold Schools, we have learned the ten things that make a school Bold.
- Practice 1
Set high expectations.
Bold Schools commit to high academic expectations for every student.
Set the barShare each goalCelebrate - Practice 2
Build strong relationships.
Bold Schools cultivate intentional relationships among students, educators, and families.
Greet at the doorCheck inWelcome families - Practice 3
Focus on joy and belonging.
Bold Schools create a fun and joyful school environment for students and adults.
Have funBelongAdults too - Practice 4
Use data for continuous improvement.
Bold Schools leverage data to identify areas for growth, celebrate successes, and implement strategies that enhance student outcomes.
Look at the dataFind the gapsAdjust and repeat - Practice 5
Implement targeted student intervention.
Bold Schools provide additional opportunities to access rigorous, grade-level content, using data to group students and address specific gaps.
Group by needClose the gapGrade-level content - Practice 6
Use assessments to inform instruction.
Bold Schools use student work and exit tickets, standardized and teacher-created short assessments, and interim benchmark tests to adjust instruction.
Exit ticketsBenchmarksAdjust teaching - Practice 7
Provide instructional support to teachers.
Bold Schools ensure that teachers have conceptual understanding of content, tools to address student misconceptions, and consistently maximize every instructional minute.
Know the contentAddress errorsUse every minute - Practice 8
Prioritize routines.
Bold Schools create a stable and predictable environment for students, where students know exactly what to expect each day.
Same each dayOn timePredictable - Practice 9
Go the extra mile.
Bold Schools do what it takes to achieve success, even if it means jumping in on the small stuff or going above and beyond.
Jump inDo what it takesAbove and beyond - Practice 10
Support the broader education community.
Bold Schools open their schools up to others and share successes and challenges to support the broader education community.
Open the doorsShare what worksSupport DC schools
Students beat expectations by more than 10 points
The 2026 Bold Performance Schools serve students from priority groups and beat their expected proficiency rates by more than 10 points. Since 2016, 72 DC schools have walked this path.
How the 2026 Bold Schools put each practice to work is in the report, pages 22 to 28. Read the report
Two districts behind many of this year's Bold Schools
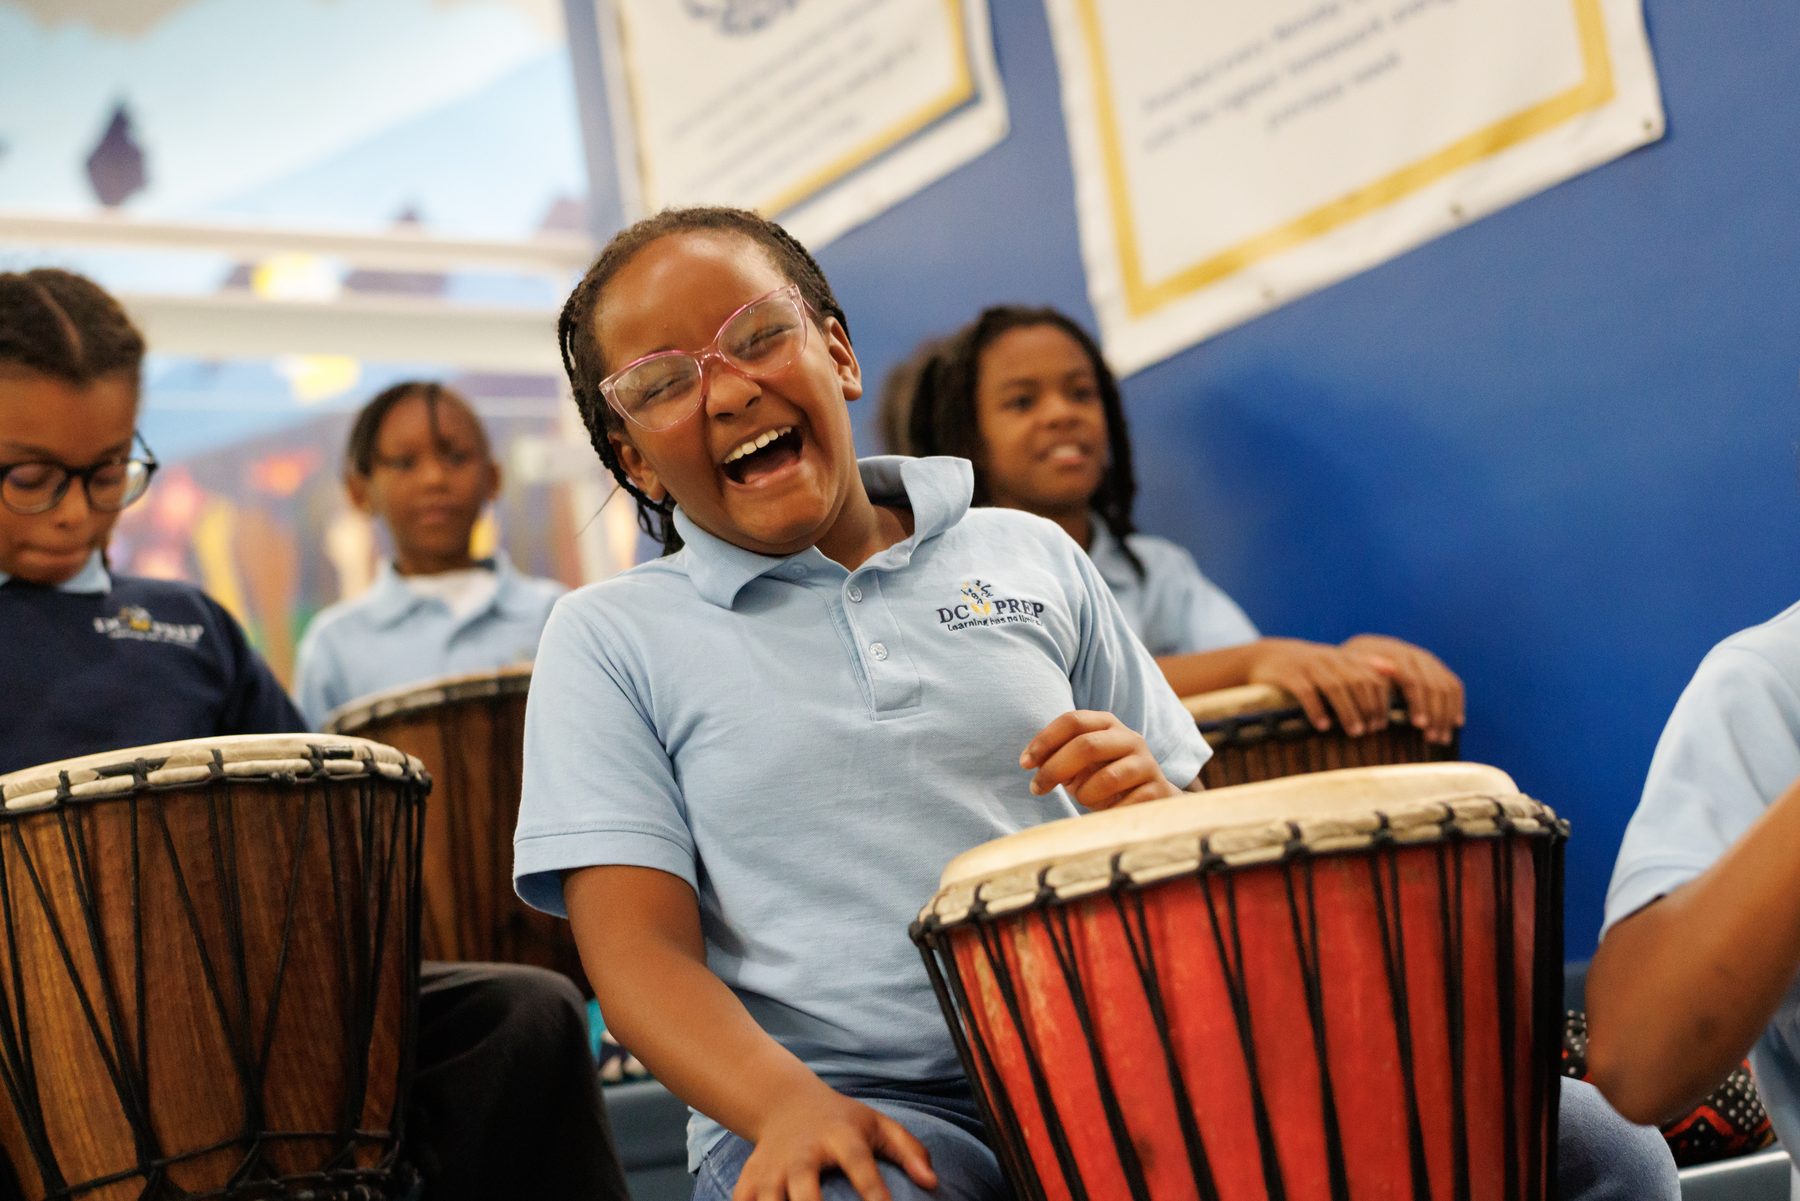
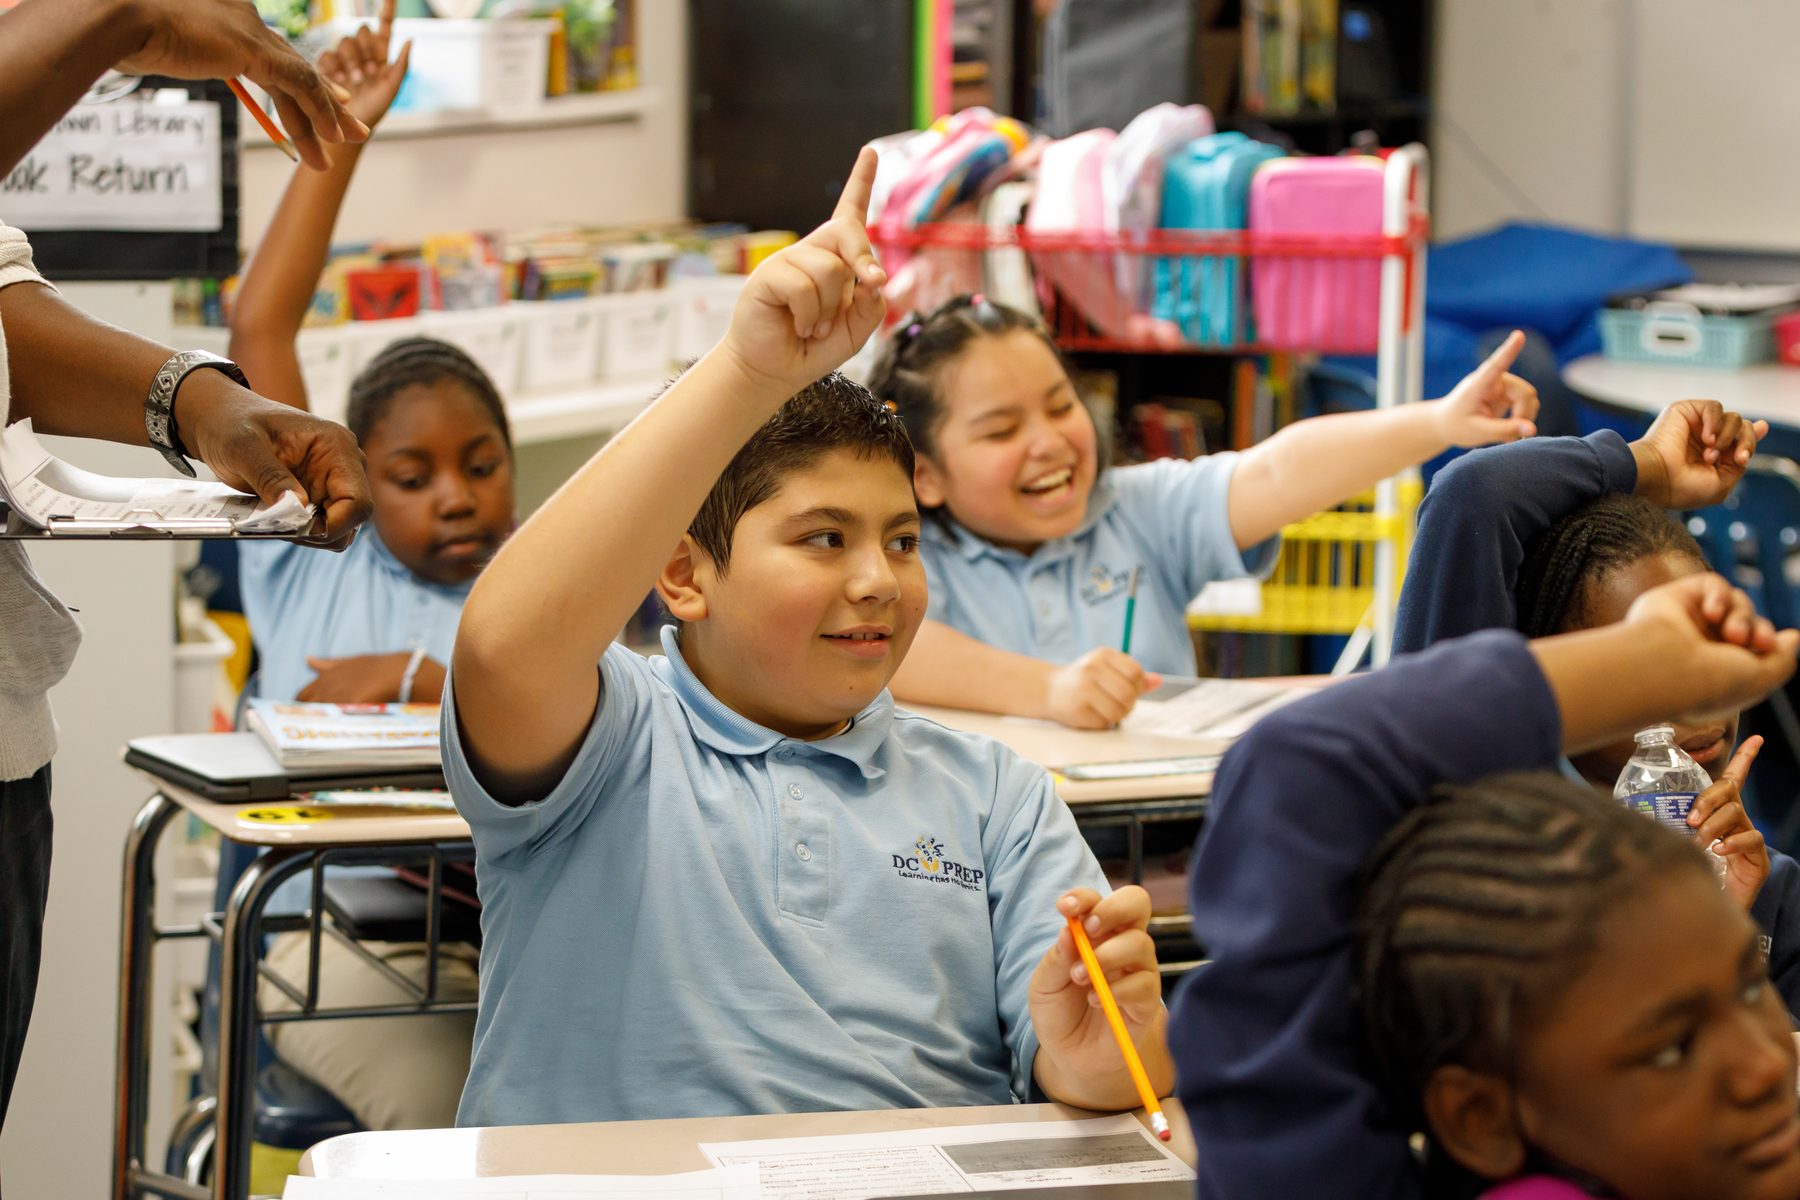
Fifteen of the 21 Bold Performance Schools of 2026 belong to two systems. Eleven are DC Public Schools elementary schools and four are Friendship Public Charter Schools campuses. The report looks at what each system changed and how its schools put the Bold practices to work.
DC Public Schools
In 2021-22, the first CAPE administration after the pandemic closure, 24.9% of economically disadvantaged DCPS elementary students met the career-ready benchmark (CAPE 3+) in math and 31.8% met it in ELA. By 2025-26, those rates reached 42.5% in math and 41.6% in ELA, gains of 17.6 points in math and 9.8 points in ELA over four years.
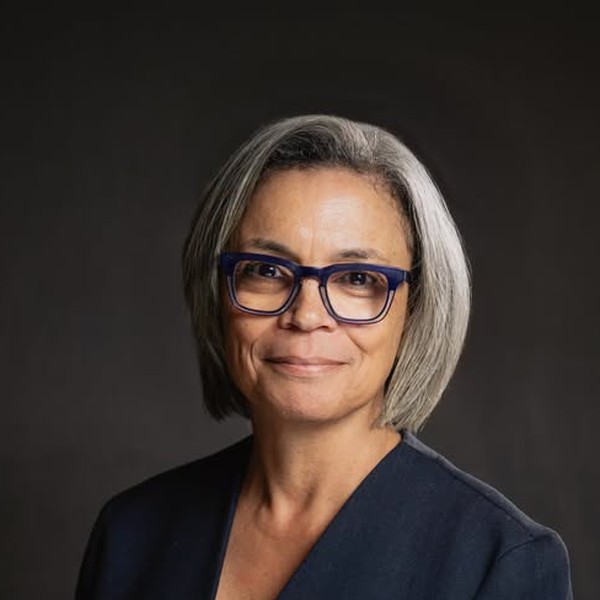
Family engagement is huge and is a very important part of the success. We must make certain that our families are aware of the curricula that we use.
Dr. Kim Jackson, Chancellor, DC Public SchoolsFriendship Public Charter Schools
In 2025-26, 72.2% of economically disadvantaged middle school students at Friendship Public Charter Schools met the career-ready benchmark (CAPE 3+) in ELA and 46.8% met it in math, compared with 47.9% and 32.0% for economically disadvantaged middle school students statewide. ELA proficiency rose every year since 2021-22, when 48.9% of these students met the benchmark, for a gain of 23.3 points over four years.
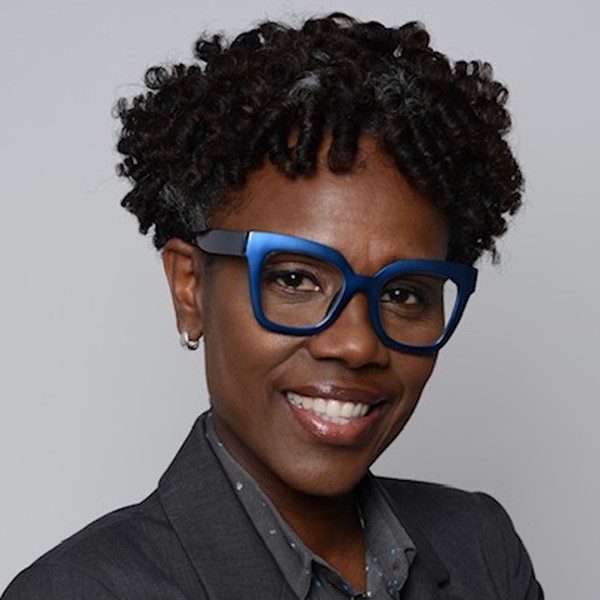
The point of looking at data is to change what happens next for students. Small-group instruction allows teachers to respond to what students know, where they need support, and when they are ready to move further.
Vielka Scott-Marcus, Chief Academic Officer, Friendship Public Charter SchoolsTen years of Bold Performance Schools, 2016 to 2026. EmpowerK12 has named Bold Performance Schools every fall since 2016, except 2020 and 2021, when the state assessments were cancelled. 72 DC schools have earned the designation in that time, and 21 earn it this year.
Read the 2026 report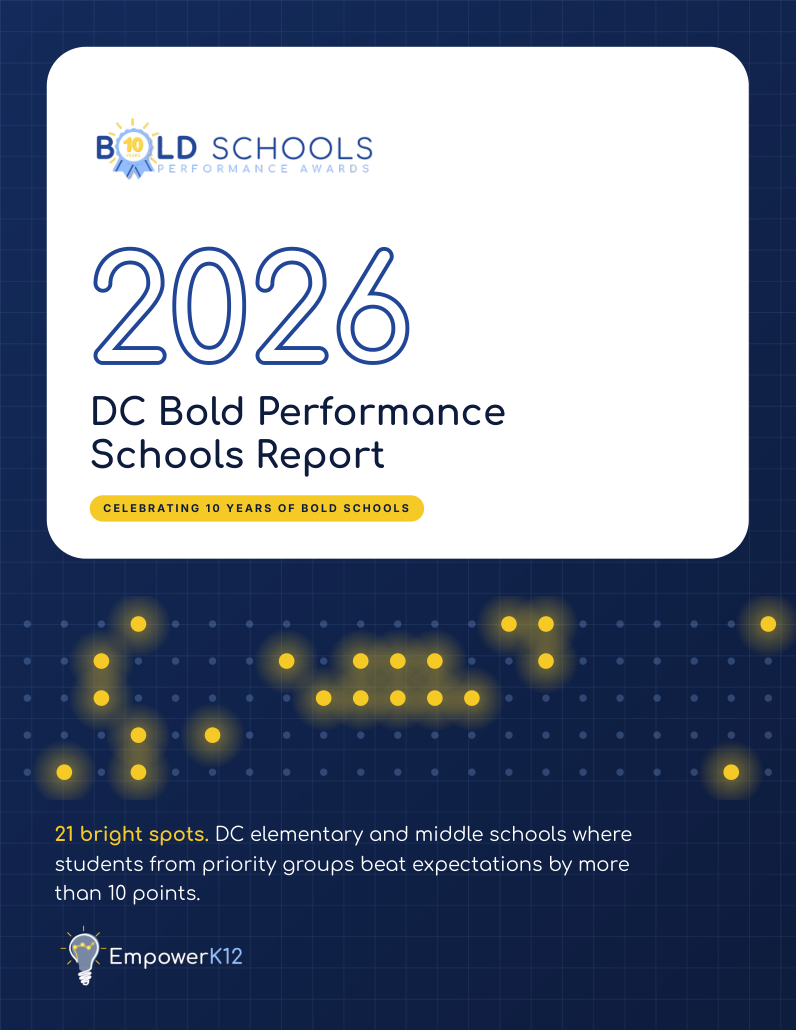
2026 DC Bold Performance Schools Report
Forty pages on the 21 schools, the ten Bold practices, the DC Public Schools and Friendship spotlights, and DC's fourth straight year of gains.
DC Bold Schools is an initiative of EmpowerK12.
EmpowerK12 analyzes data utilizing rigorous methodologies to help education stakeholders understand how schools are performing on a variety of metrics, including how well schools serve at-risk students, which is central to the organization's mission. Learn more about EK12's mission and how we support bold school improvement through access to rigorous data analytical tools, training educators to turn data into action, and by fostering collaborative improvement by identifying real-time bright spots across a broad network of schools at empowerk12.org.